Published by Transport Trackers on 20 March 2012 and reproduced by courtesy of Charles de Trenck
- Global growth is back… or is it?
- The 90s-00s had seen a 10% rate of containerization
- In a real sense the Greenspan Illusion 2002-07 was +2-3%
- Peak distortion was +5%
- Until the ‘00s acceleration containerization centered around 8%
- Recently averages have been closer to 5%
- Our working assumption is long term 7%, short term 4-7%
- Med-case on vessel supply is normalization by 2016
- We are at about 1m TEU of capacity marginalized now
- We also have many quasi-obsolete ships….
- Obsolescence can be down to wrong size ship
- Gap between weak and strong is huge (operational and financial)
Figure 1: Mapping Deviations From Long Term Growth, ’95 – ‘ 12E

Source: Transport Trackers
Containerization: A New Phase of Lower Growth Since 2008…
Goldilocks… For Mature Audiences Only. We’ve been dying to use this title. Growth has decelerated long term. In essence we are in Year 3 of China’s export story deceleration. And yet, the US is now recovering a little better than expected 6 months and Europe has stabilized a little. A recovery US economy has raised a lot of hopes. But this is not an ordinary recovery by any stretch. Not in terms of economic activity and neither in terms of container shipping.
The bad news for some time has been there are too many ships. The silver lining is that there are too many of the wrong ships out there. But to get to the silver lining we still need the consolidation of the coming years. Keynesian over-spending has not helped, as it has kept demand artificially higher, which may offer false hope to owners of certain vessel types.
Some vessel owners and operators have pointed out that the average useful life of vessels in coming years could fall to 20 years from 25 years. Of course we are not going to get accountants and owners to recognize this. But effectively there are many ship types that could head to the scrap heaps given small nudges. Many ships in the range of 5,000 – 6,000 TEU could be severely marginalized if they consume too much fuel or are owned by financially weak owners. At the moment, according to Alphaliner and others, we are at about 1m TEU of idled vessel capacity. This is against a standing fleet of about 15.5m TEU according to March 2012 Clarkson data.
Here is what the fleet growth looks like long term. The dotted red line is the long term trend. The bold red line is the actual capacity data. The problem was the bold line exceed the long term trend just as demand decelerated globally – meaning the problem is not fully over unless demand really takes off (and more vessels taken out). We may have strong players come out better, and we may have rebounds. But a full cleaning is still needed.
Figure 2: Container Capacity Growth in TEU, 1994-12E
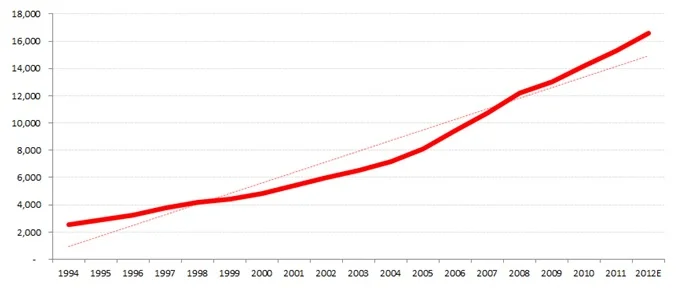
Sources: Clarksons; Transport Trackers
The problem of too many ships is not going away unless 2012-13 sees a very strong economic recovery leading container demand to jump from 4-7% to above 10%. When we overlay demand onto capacity the problem crystalizes.
Figure 3: Long Term Demand vs Supply… and the big gaps, 1995 – 2012E

Sources: Clarksons; CI; Carriers; Transport Trackers
In terms of vessel supply there are too many ships headed for the long-haul trades. We have all known this. However, there is one small positive structuraldevelopment, though there are still too many ships. Recently, most analysts would have said that 10,000+TEU ships were ALL headed for the Asia-Europe trade. But this month MSC deployed a 12,000TEU vessel into the Transpacific, which offers the potential for less ships to flood into the Asia-Europe in this critical 2012-13 period (when there are too many of these ships). However, it is still not expected that there will be a flood of 10,000+ TEU ships flowing into the Transpacific before 2014-16, as most terminals will be able to properly handle these ships.
Nonetheless this is a small positive development. Back to reality: About 50% of vessels in the orderbook are 10,000+ TEU ships. In terms of the 2012 orderbook, which will still be at least a couple percent above demand there is little that can be done as most ships are close to fully paid. But by 2013-14, we should expect the orderbook to be stretched out into further years. And by 2015-16, we should have been through the difficult period of dealing with marginal tonnage and experience better demand – supply balance. Unless… (play Jaws music here). One significant difference will be the capex gambits will cost more with 10,000+ TEU and 14,000+ TEU ships, narrowing the field of players.
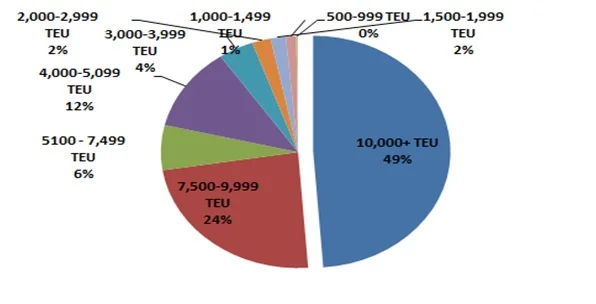
For the immediate future here is a snapshot of the fleet distribution and orderbook, with a focus on seeing (upper pie chart) that there are a lot of 4,000 – 7,500TEU ships (about 40%) in fleet which may have trouble identifying their use, especially if fuel consumption is not good. And then, in the orderbook (lower pie chart), there is a need to focus on about half being 10,000+TEU ships destined for long-hauls.
Figure 4: Types of Ships in the Fleet (10,000+ TEU at 10%..., but…)

Sources: Alphaliners
Figure 5: Types of Ships on Order(…just about half are 10,000+ TEU…so still a problem ‘12-‘13)
Sources: Alphaliners
And here is a snapshot by carriers:
Figure 6: World Fleet and Orderbook Distribution in TEU (Jan/Feb 2012)

Sources: CI; Transport Trackers
It is interesting to see that the top 5 and top 10 generally have larger than average ships on order than the world fleet. On average a ship on order has a profile of 7,275TEU per ship – but 3 of 4 13,000 TEU per ship avg size orders for their OB are in the top 10. CMA, Hapag and Hanjin pop up as having the greatest concentrations of big ships on order. This can mean different things of course, without further analysis, but generally speaking it means that their wagers were in the long haul and Asia-Europe trades. So, who will still feel the need to order more? For delivery when? Will they have the patience to wait for 2015-16?
Demand and Rates
Our view was that the negative volume momentum data was running out in 4Q11 and it was a 50-50 shot as to the base would build higher or stay flat. It depended somewhat on equities and how people felt following a long bout of declining demand growth post the big post crisis rebound. Asia-Europe we expected, and still expect, to be a little weaker than the US. 2012 at the moment should see mid-single digit demand growth long haul, coming up from zero growth experienced into end 2011.
Figure 7: Long Haul Container Demand Growth, Jan ’06 – 1H12E

Sources: FEFC; CTS; JOC; Transport Trackers
For Rates, we agree they have/had to move up, but…. We are in the part coming from the bottom of the cycle where rate increments – “GRIs” – should have some success. However, it is always pretty much about partial, not full implementations. So given that rates in 2011 fell about 9% across the board while nominal fuel costs rose some 30%, it makes complete sense rates should rebound.
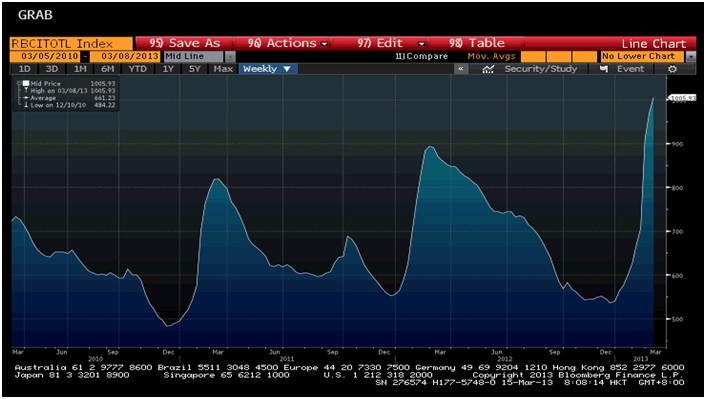
Below is our long term tracking of global rates
Figure 8: Global Average Rates and Long Haul ex-Asia Rates vs Global Demand, in Percent 1980 -2012E

Sources: CI; Carriers;Transport Trackers
Rates out of Asia will rebound faster than global rates, as is the usual pattern. But also higher rates are “merely” recouping the lost ground from higher bunker fuel prices. In fact 380 CST bunker is pretty much at record levels above $730/ton, which is where they were in 2008 when WTI was at $140+ versus current $100+. Of course there has been the Cushing oversupply issue. But also this has meant hedging has not been effective. Brent also was still higher in 2008 peaks than current levels. The issue of bunker costs and vessel efficiency is an entire report by itself. But we would emphasize that players with better fuel utilization ships will do better than those operating legacy ships. At the moment we are looking at bunker usage being about 30% more efficient on newer design vessels. If oil prices stay high this will offer an immense advantage to those positioned with more efficient vessels.
Author: Charles de Trenck / Publisher: SCMO