Published on 15 March 2013 in "I am an Analyst" and reproduced by courtesy of Charles de Trenck
BDI 880 +6%: The BPIY continues at rebound levels of mid-12 and is up about 3% on the week (slope of rebound is slowing), with long term concerns on China coal and ore inventories remaining. Reference ore prices came off quite a bit this week. Comments going around recently were that China is not going to buy ore at recent peaks. Moreover steel inventories are pretty chunky even if ore levels are down … A question would be the new run rate needed for inventories, which does not have to be at previous averages, and given lower growth trajectory for China…. Keeping a quick track on the dollar index, it is up about 3.6% YTD. Strong dollar is usually negative for shipping/commodities… only that shipping is so down at this point I would not hold this relationship key, except for its general impact to the commodities world… TANKERS behaving better… some are cautioning to keep an eye out for news on Suez Canal and Egypt
Investment stance: Gold shares still getting killed. I have stayed long dollar long US, but most things I have held that are China-related has been weak, ex anti-pollution themes. My health, anti-pollution focus brings me to flagging [XXXX] and how fast (after being ignored since IPO) it has gotten on the map. Macro wise (like GLNG after the Japan earthquake), it makes sense to look for names that can play the theme on China Cleanup. For me it has been Platinum. But I think clean engines… clean-up equipment companies all fit into a China eco-friendly theme that will be around for a very long time
MAIN APPROACH UPDATE
My approach has remained the same throughout – be conservative in a highly volatile sector.
Shipping, Logistics, Ports for me have always been about staying in tune with the pulse of world trade. On the whole, I don’t pay attention to WTO statements, national GDP data, senior management statements, rate hike announcements, etc. I believe in running real time series and cross-referencing what their inter-relationships are saying.
When is a correlation important? When could it breakdown? What is the raw volume data looking like? What time of the year is it? What’s our visibility like right now? Where is the value? In what currency or value marker terms? I have believed gold has been a more true marker of value and that it has shown US equities in general to be in the cheaper range, while not discounting the need to own some gold long term to defend against central bank fiat currencies gone wild. At the same time I have seen value in holding more dollars than other FX in recent months even if I always believe we should have a diverse holding of currencies and commodities.
My main support from oversold levels in the last few years has been certain areas of the US property market.
When it comes to shares I have stayed away from focusing on individual stocks “in and of themselves” and preferred to recommend making our own ETFs. Even in a weak market for shipping there has been a way to get exposure. I need companies with track records, reasonable managements and reputations, liquidity, market leadership, defensive exposure to liabilities (despite the Fed, Central Banks and commercial banks (up until 2008-09) telling the whole world to gear up on mind-numbingly low interest rates. I believe currently in long term ETF bundles for:
- Energy/infrastructure: Canada, coal, oil…companies oversold and unloved and generally trading at lower ends of multiples, whether Warren likes them or not…
- Shipping/Logistics/Traders: Market leaders and from levels that were relatively low long term. There are a few good leaders in Europe in this space. There are a couple in the US, and a few in Asia. For corporate governance/ethical reasons, I try to stay away from some companies with bad names (and abusing common sense such as in Ethanol…)
- US Consumer/healthcare: Without supporting big pharma overall, I have looked for defensive yield, good management. I have traded around positions in some of the big heavyweights of US retail/discounters
- Health: For a double dose and core concentration, I am increasing where and when I can clean living focus companies. There are not many listed and they trade at premiums. I have learned that sugar based consumer product and beverage companies are the biggest sells out there. America will have to change!
- Tech: I see this as consumer, and I have looked for bellwethers on sell-offs
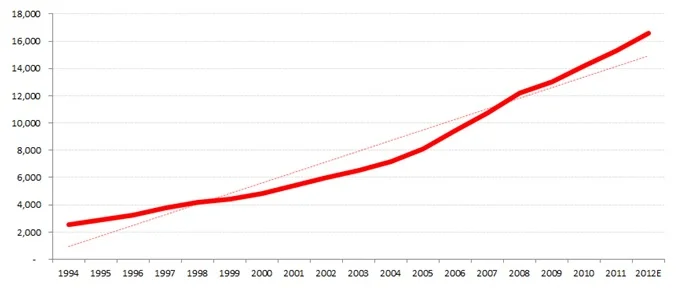
China Rebar Inventories…
Source: Bloomberg
Note: Shanghai steel inventories higher in recent weeks but way below ‘10. BUT checkout Wuhan at 100% over ‘10 levels!
What happens to a stock when it’s got the right theme (note the share volumes out of nowhere)
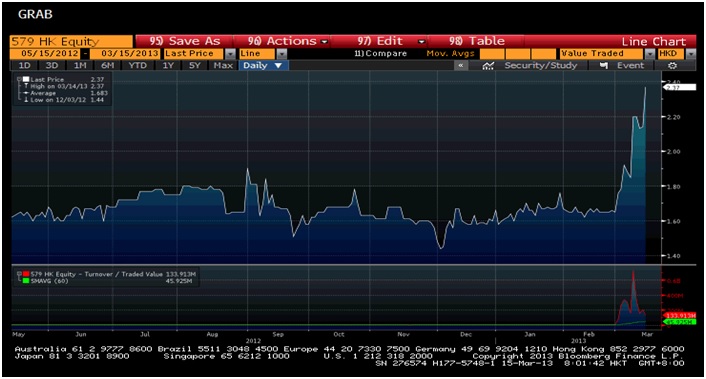
Source: Bloomberg
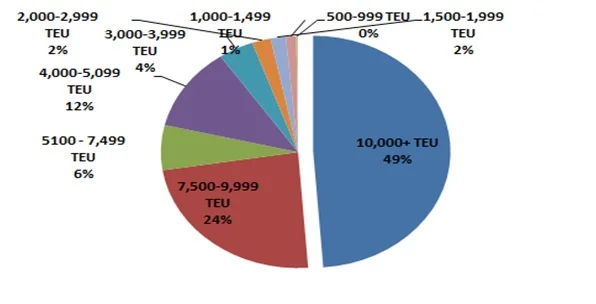
CONTAINERS/PORTS/LOGISTICS
Data for Asia-Europe remains weak, with 2012 at about -4% (always getting revised…)...Hopefully 2013 can be better, but issues such as how weak the Euro is against the dollar and Italian and other crises could have positive or negative impacts. My view has been that the dollar is in steady rebound mode. If the dollar continues higher this could make Asia a little less competitive if Asia currencies tend to gravitate around dollar strength. On the flipside and to a less impactful degree for the Asia trade, this could help this could eventually help Europe export more. In the Transpac, although 2012 growth was not negative, the 2% type growth from Asia to the US was lower than 3-5% growth many of us had expected several months back. … Interestingly, US inventories were reported to be higher. LB and LA ports reported better Feb container port data with LA +17.0% and LB +36.6%. CMA is key driver of LB growth.
Asia Outbound Current Pattern (we’ve been relatively flat in big picture for some time now)
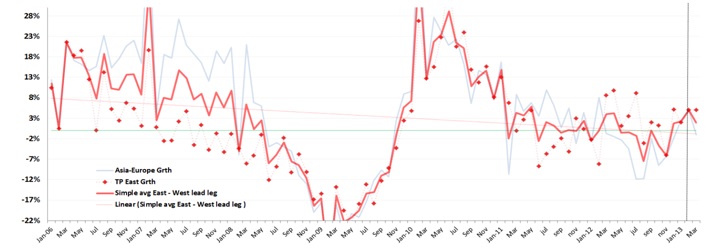
Source: Charles de Trenck
Note: 4Q12 picture not complete/still seeing revisions… 1Q13 needs March data to see proper direction given Chinese New Year interuptions
Question: How often do we get a jump like this in inventories?
(as we had in US this week…is it cause sales about to jump more? Or will volumes have to slow a little more?)

Source: Bloomberg
APL shelves the 53footers: Launched in November 2007, APL's custom-strengthened 53ft ocean capable containers are to be retired from the carrier's South China to Los Angeles service due to poor returns. “The economics just didn't work,” according to APL Americas' CEO, Gene Seroka. 53ft containers are basic to US domestic transportation. The 53 footers have about 60% more capacity than 40 footers Until APL's launch of the hybrids, standard 53ft containers were not strong enough for ocean voyages.
APM Terminals to operate Turkish terminal: APMT (Maersk) will build and operate the Aegean Gateway Terminal under a 28-year concession, with a $400m and in a phase I 1.5m TEU facility for mid-15 start. Bulk will also be part of operations. The port lies in the petrochemical complex of Petkim in Nemrut Bay, close to Izmir, the second-largest industrial city in Turkey. The initial 1.5m TEU capacity at the new container terminal is about 50% more than the current city port of Izmir at about 700,000 TEU a year. With a depth alongside of 10 m, Alsancak can handle vessels no larger than 2,500 TEU.
CSCL takes a share in APM (Maersk) Belgium terminal: CSCL is taking 24% in Zeebrugge from APM Terminals. The 2-berth terminal handles about 380,000TEU but capacity is for 1m TEU. SIPG has 25% as well. APM soldfor EUR27.2min 2010 the 25% stake.
SITC 94$m in 2012: I wasn’t too happy about the timing of the IPO, though my level of concern was never at the level of Rongsheng or HPH in terms of lack of compunction from company and bankers on IPO process/timing. Another issue was the positioning of the company’s image. That aside profit seemed to please in 2012. SITC said revenues rose to $1.2bn in 2012 from $1.1bn the year before and given about +15% in volumes. SITC’s revenues from China fell from $489m in 2011 to $439m in 2012. S Korea revenues more than doubledto $131m. Japan was + 2% to $428m. Japan is known for being a killer trade with SITC being a main culprit. In addition China- Japan relations will hold back growth here. SITC’s capacity for the year 2012 amounted to 1.8m TEU, up from 1.5m in 2011, it said. It also expanded its land-based logistics business, revenue climbing to $739.6m, from $673.6m in 2011.
RCL still in red….Horizon still in red: I neglected to mention RCL of Thailand posted a $62.7m loss for 2012. I notice shares rebounded in last couple of days though…Horizon Lines over in the US (that little carrier we spent some time a few years ago flagging for some excesses from Beltway Bandit types over in Washington DC) also reported its 2012 loss at $46.1 m.
Container bonds: China Shipping Group issued, according to reports, two batches of short-term notes worth about Rmb3.5bn ($562.9m) to fund container manufacturing and shipbuilding. Gee, didn’t CSCL just sell a whole bunch of containers to book some needed disposal gains. My head is spinning. The first tranche of the Rmb2.5bn paper, due in six months, pays an interest rate of 3.85%. The paper is jointly underwritten by China Development Bank and China Everbright Bank. Rmb700m of the new credit will “replenish the working capital of China Shipping Industry.”
BULK/COMMODITIES
Diana disappoints: Diana reported 4Q12 net income of $5m against $20m for the same period last year. Judging by the share reaction investors were not happy. It certainly has been a tough market out there. Vessel operating expenses were +30% (daily vessel op ex +6.8% to $7,128/day) against operational stats showing utilization in 4Q12 at 96.3% against 4Q11 at 99.2% 30 vessels end-12against 24 vessels end-11. TCEs were $17,681 in 4Q12 against $25,714 4Q11.
Also see http://seekingalpha.com/article/1274661-diana-shipping-s-ceo-discusses-q4-2012-results-earnings-call-transcript?part=single
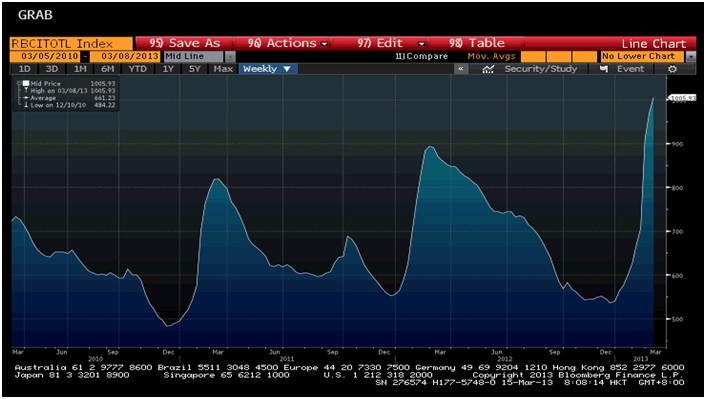
Speaking of Bulk, and rebounds….It is interesting to see Precious Shipping enjoying a little of a rebound

Source: Bloomberg
Is gold price fixing investigation next? According to the Guardian and the WSJ, the London financial sector isbracing for another official investigation into alleged price-fixing following reports that a US regulator is considering launching an inquiry into the City's gold and silver markets. The Commodity Futures Trading Commission is discussing whether the daily setting of gold and silver prices in London is open to manipulation. The CFTC is examining whether prices are derived sufficiently transparently. The system of setting gold prices in London is unusual and involves a twice-daily teleconference involving five banks – Barclays, Deutsche Bank, HSBC, Bank of Nova Scotia and Société Générale – while silver is set by the latter three. The price fixings are then used to determine prices worldwide….
ENVIRONMENT
See comments on Beijing and China pollution front page and China sections….
The cost of compliance – sometimes out of reach: Lloyd’s List makes a good point that new environmental regulations coming into play over coming ears will see owners forced to instal ballast water technologies, and possibly seek to purchase exhaust gas scrubbers and take other fuel efficiency measures… But they may not be able to get the funding to do it! AP Moller Maersk expects rule compliance will cost the shipping industry $20bn a year. .. Newbuilding loans often come with clauses, or covenants, that dictate vessels must remain fully compliant with all maritime regulations. Owners that struggle with rule compliance, such as the pending ballast water convention, could find banks use this to foreclose on loans rather than provide more capital. …
BNSF to test LNG locomotives: BNSF, a subsidiary of Berkshire Hathaway, is said to be the second-biggest user of diesel in the country, after the US Navy. And now it is working on with the two principal locomotive manufacturers, GE and EMD, under Caterpillar, to develop natural gas engine technology that will be used in a pilot LNG locomotive program. The WSJ ran a big story on BNSF this week. This follows stories back in January raising questions about BNSF monopoly in the Bakkenfields and proposed pipelines debates, in other words the Keystone XL pipeline…
One of Warren’s better investments in recent years
(with some behind the scenes questions on market “influence and pipelines….market dominance issues)

Source: Reuters
TANKERS/SHIPBUILDING
Scorpio more share sales: Scorpio continues to raise funds from investors with a further 29m shares tranche of its common stock at $8.10 per share, a discount of 35 cents. Shares again reacted well post placement. The move aims to raise $235m to fund its acquisitions war chest, to pay for further acquisitions and provide working capital, as well as for general corporate purposes.
DSME going into Jackups: DSME is aiming to build up jackps, to take share away from Keppel and Sembcorp Marine that have about a 70% market share. … The need to diversify and be flexible is paramount given a lackluster pipeline for ships over coming years.
STX OSV to stay listed…: This has been one of the most unexciting takeovers in recent memory. Shares were at lows and they remain at lows. Meanwhile Fincantieri which failed to get much more than 4.9% shares in OSV to add to its 50.7%, will rename STX OSV as Vard
COSCO….oh COSCO, when will you learn
My mother would have said… “COSCO, you couldn’t organize yourself out of a paper bag if you wanted to…”
Months after saying it had some re-organization ideas planned to avert issues such as the Shanghai Stock Exchange placing trading limits on it due to potentially running into a third year of losses, COSCO Holdings ( H and A shares) this week came up with a plan to sell its 100% COSCO Logistics division back to COSCO Beijing. But Bloomberg later in the week quoted that over $4bn could be raised! The timing would be awful, and one might wonder what the company would look like after selling $4bn in assets!
Planned sale of COSCO Logistics with recurring earnings power $100+m range, with long term upside: …Here we go again. This is the division that was injected into COSCO Pacific (49%) to boost assets before IPO of COSCO Holdings, while also earning extra fees for senior directors. Then the 50% was sold back to COSCO Holdings...and now it may get sold back to Parent. COSCO had bought the other 51% from its parent in 2007 prior to its Shanghai IPO. …Not only is this is a poor band aid, it is also a look-see into a history of asset shuffling.
Event (WSJ summary) HK— China COSCO Holdings plans to sell its logistic unit to its state-controlled parent, China Ocean Shipping (Group) Co., as part of the Chinese shipping giant's efforts to improve its financial results in 2013 and prevent a possible delisting from the Shanghai Stock Exchange.
Initial thoughts (Tuesday): It is not any one transaction, but in the pattern that the full picture of the COSCO Logistics drama can be seen.
Original COSCO Holdings IPO process and valuations… a few long term questions on GROUP as whole here:
- Asset transfers back and forth
- COSCO Logistics continuous transfers between divisions
- Wei Jiafu role
- Add ship asset timing gaffes – the big ones on the ships at wrong prices
- Bulk division massive underperformance (and check those fees please)
- Accountant issues… PWC as accountant for life
…
COSCO Logistics follow on thoughts (Wednesday)
….COSCO Holdings dropped a fair amount (about -5%) on the back of its nonsensical logistics unit planned sellback (according to everyone else, check market response) to its parent to book an intended disposal gain to avoid (or partly cover losses against…) Shanghai Stock Exchange chastisement, and due to its guidelines on loss making companies, etc. As the week wore on it became clearer that more asset sales may be needed, potentially up to over $4bn (??), according to Bloomberg.
….CIMC also fell in with COSCO Holdings as a stake sale was mentioned in press as a potential strategy by parent. By Wednesday it was the turn of COSCO Pacific to sell off at about -4% on early morning trade.
As to CIMC – I would not off the bat agree that it should start a new business in ship leasing, as per recent reports, since it has no core competence there. … and especially as it is competing against its partial parent, COSCO, …the other being China Merchants…. But if it is going to get cheap money from China Inc, and for container ships mostly built in China, and aim for economy of scale as it appears to be aiming for. …Perhaps there will be a role for it as ship lessor down the road. It is certainly too early to tell now. But as such I am fascinated to see what happens next on this front. Who knows – maybe COSCO will do a sale-charterback of some selected ships to vehicles such as CIMC – and at some point where CIMC could be more independent of COSCO (and that be a good thing). Who knows? As observers we need to see if CIMC becomes a ship lessor of scale, and if it gets the portfolio management thing…
As to COSCO Pacific – there was a 1 day delayed effect and selling started on Wednesday rather than Tuesday for the parent, potentially in response to the messed up strategy of the various parents. Who knows…
I continue to ask for mainstream press to take a proper look at the COSCO Group of companies. Even the easy pieces such as the crazy sale of logistics back to Beijing parent can still not be covered in any great depth. The SCMP put one small paragraph on it on day 1, followed by a Bloomberg story on day 2. The WSJ tried to do a better job. But there is still no understanding of the process and failures of the Logistics division, which was first pre COSCO Holdings IPO injected into COSCO Pacific at 49%, etc (I have explained this process before*) ...This division and stakes in it have been transferred back and forth with investors at times paying money for it. Now it is taken away from investors. For all we know the Beijing parent may sell it back to investors again later in another IPO!
For its own merits and failures, one forwarder had this to say about COSCO Logistics upon hearing of its intended sale back to parent:….
“Cosco Logistics? What is it? Sell what? Over the years Cosco has spawned logistics companies like Kenwa, who "jumped ship" joined CSCL as a slot charter semi NVOCC and changed their name to Rich Shipping. Cosco Air had one if the first A licenses for air freight. But had no sales offices anywhere in the world and went from being one of the only master loaders to being one of the only ones not moving any significant cargo. This is an organization that wasted the good years and ends up without a clue.”
*At first the logistics division was an internet concept back in ’99 – ‘00, running off the back of B2B relationships of the Group’s back end, along with legacy businesses accorded COSCO and other China state companies, legacies such as running off printers trade documents for a fee, as well as other captive China business. Ironically this was foisted onto investors first by Sinotrans Logistics, again at wrong valuations (because China was going to have to phase it out, and this was not properly explained to investors by bankers, while syndicate rules by bankers limited what analysts could say in deal research, for instance…). COSCO Logistics got the tail end of this. As COSCO Logistics grew, and as logistics in China grew by leaps and bounds with COSCO underperforming some of this BUT still growing, COSCO got higher valuations for injecting its stake at first in COSCO Pacific, on its way to playing a shell game for investors managed by investment banking franchises that won the COSCO Holdings mandate from COSCO leaders such as Wei Jiafu. What Weijiafu wanted was a big IPO for COSCO Holdings…one which raised lots of money for a company that had been fattened up – so they injected a COSCO Logistics stake first into COSCO Pacific. … Later on COSCO Pacific would sell its COSCO Logistics 49% stake to COSCO Holdings – and now COSCO Holdings is selling its larger COSCO Logistics stake back to its parent. … WHAT DID SHAREHOLDERS GET FOR THIS 10 YEAR HISTORY OF COSCO LOGISTICS? ….
…
As George Clooney said in one of his films on CBS News early days newscaster Edward Murrow….Goodnight and GoodLuck (http://www.youtube.com/watch?v=kCaBCdJWOyM)
“Anyone who isn’t confused really doesn’t understand the situation.”
CHARTS OF THE MONTH … Check out the number of buy ratings here (also look at Sing MRT vs HK MTR)
SMRT Snapshot of broker ratings
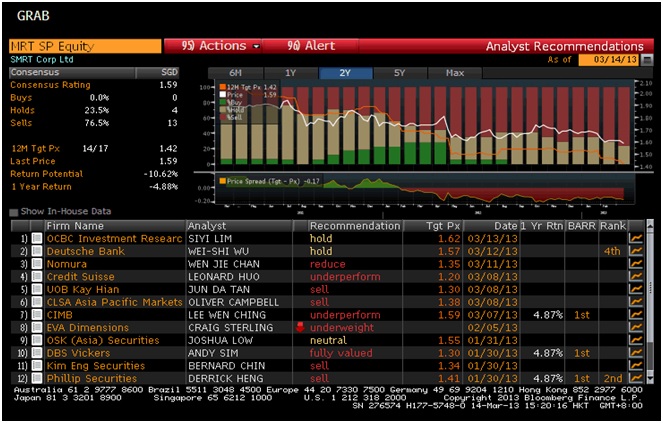
Source: Bloomberg
No love lost for Singapore’s mass transit after it mishaps

Source: Bloomberg
CHINA NOTES
Pollution in China remains one of my key themes. I believe China’s leadership will be defined by what it does here, given that many local and some senior leaders openly allowed for decades the dumping of inordinate waste and unchecked wasteful production all over China. 10 years ago my main complaint was allowing for economic growth to be above what was necessary while allowing antiquated steel, coal, etc capacity to run alongside newer, cleaner production facilities. The list of mistakes is long. China needs to go into full reverse on this.
A couple of years ago, my friends at Environmental Services (Eisal) flagged China Everbright International as being on the right theme, though others have raised concerns on cash flow which must be examined long term….
Taicang strong growth…: Taicang terminal reported a total container 4.01m TEU throughput in 2012, or +39%. So farYTD Taicang is about +18% for Jan-Feb. Suzhou port has focused on Taicang for several years, now with MTL (51%) and COSCO Pacific (39%) as ownershttp://www.tac-gateway.com/eng/index.jsp
Ningbo Port planning Rmb 1bndomestic bond issue: A three-year bond, underwritten by Bank of China International, is the second tranche of a Rmb2bn quota approved by China’s securities regulator in 2010. Ningbo Portraised the first Rmb1bn in April 2012 at a fixed interest rate of 4.7% per annum. Rates of the new issuance will be decided after bookrunning is complete, Ningbo Port said in an exchange filing. …. SIPG.bonds: SIPG will sell 3bn RMB in one-year bonds, according to a statement on the Shanghai Clearing House’s website on 5 March.
Qingdao Port ore terminal: Qingdao Group has started the operation of its new 400k ton iron ore terminal at Dongjiakou port, SinoShip and others reported. This is one of the largest iron ore terminals in the world with annual capacity of 40 m tons. Dongjiakou becomes the first Chinese port that could officially have the technical capacity to receive Valemaxes.
Iron Ore: As of March 8, combined iron ore inventories at 30 major Chinese ports declined by 2.98m tons from a week ago to 66.54mtons, the lowest level since mid-January 2010 according to data from mysteel.com. Iron ore stocks decreased to 77.75 m tons at 34 Chinese ports compared with the previous week, according to the China Securities Journal…. See the steel inventory charts. This has been expected and is a continuing trend. One reason given is that ore prices are on high side and buying would only come in at lower price points. One additional thought, as seen with US oil inventories a few years ago, is with industry deceleration comes a need to seek normalization around new averages as the old averages get thrown out the window.
From Caixin
(http://shanghaiist.com/2013/03/12/infographic_chinas_new_super_ministries.php)

Author: Charles de Trenck / Publisher: SCMO